The following is an overview for querying Elasticsearch. Over the years I have tried to assemble developer notes for myself and my team on a variety of platforms, languages and frameworks, a type of cheat-sheet but with context, not a comprehensive how-to, but a decent 15-minute overview of the features we are most likely to implement in a given iteration.
Explore the Elasticsearch official documentation.
§2026 Update
The queries here still work, and they run the same on OpenSearch, which is what I use now instead of Elasticsearch (I get into why on the Elasticsearch setup post). Every match, range, bool/filter, and aggs example below runs unchanged. Two structural things did change, though, between the Elasticsearch 6 I wrote this against and current Elasticsearch or OpenSearch.
Mapping types are gone, and that touches several examples. Elasticsearch removed mapping types in 7.0, so a document no longer lives under a type:
- The document URLs lose the type segment.
PUT /example/test/123andGET /example/test/123becomePUT /example/_doc/123andGET /example/_doc/123. The Vocabulary section below describes documents as “grouped by type”, which is no longer how it works; there is one implicit type per index now. - Mappings lose the type level. The
_mappingoutput and the create-mapping body below wrap fields under"mappings": { "test": { "properties": ... } }. Today that is just"mappings": { "properties": ... }, with no type name. - Responses drop
_type. The Get Document output below includes"_type": "test"; that field is gone in 7.0 and later.
hits.total is an object now. The aggregation outputs below show "total": 6632. Since 7.0 (and on OpenSearch) that is "total": { "value": 6632, "relation": "eq" }.
The search bodies and aggregations themselves, term, range, bool, and the terms / avg / min / max / percentiles / histogram aggs, are all unchanged.
Original article below. Everything from here down is the post as originally written. The 2026 Update above covers what’s changed since.
§Motivation
My team and I work with a lot of SQL-based data, from MySQL, SQLite and even our large Cassandra cluster, however, our reporting systems are built on Elasticsearch. Transitioning our thinking from SQL to the Lucene syntax on occasion requires hitting the docs. However, most technical documentation is either for getting started or gives you every variation of every feature, which is great when you are neck deep and need a specific problem solved.
§Following Along with Elasticsearch and Kubernetes
Many of the examples I use in the range and filtering examples below are a result of setting up a reference implementation for supporting the ingestion of High Traffic JSON Data into Elasticsearch on Kubernetes. If you followed that guide, you could run against a similar set of data.
If you want to set up a production-grade Kubernetes and Elastic cluster, I recommend checking out my Production Hobby Cluster guide, followed by Kubernetes Team Access, RBAC for developers and QA, Production Grade Elasticsearch on Kubernetes, Kibana on Kubernetes and finally High Traffic JSON Data into Elasticsearch on Kubernetes.
In a few hours, you can have a highly-available, horizontally scalable, big data solution, ready for enterprise style experiments, and with some domain-aware tuning, a full production system.
Below, I access the Elasticsearch API through my local port 9200. You can install Elasticsearch directly on your workstation, or port-forward services from a Kubernetes cluster.
kubectl port-forward svc/elasticsearch 9200:9200 -n the-project
§Vocabulary
Elasticsearch inherits the Lucene vocabulary, and so it’s best not to think of namespaces, tables, rows, and columns. Elasticsearch is built around indexes, that index a collection of documents grouped by type. Documents have fields which point to values and have an assigned data type. Elasticsearch indexes also contain inverted indexes, mapping field values to document ids.
- An index is a collection of documents.
- A document is a record in an index.
- Fields are typed elements of a document.
- Terms are the values from the index documents use as keys for an inverted index.
- An inverted index maps terms to document ids.
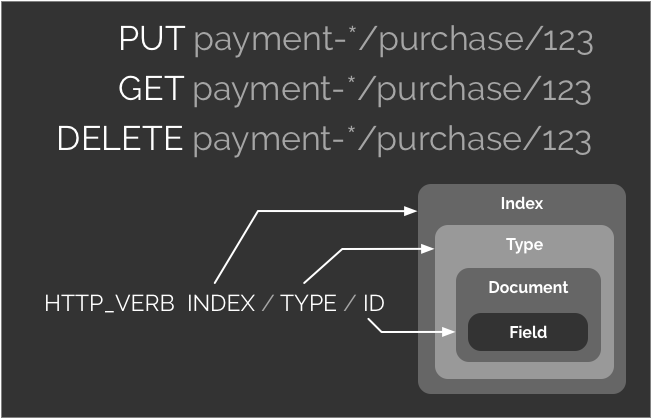
With Elasticsearch it is common to split indexes by date for time-series data. Indexes with names like payments-20180801, payments-20180802, payments-20180803 can be queried together with a wildcard, for instance, queries needing to search all payments for August may reference the index payments-201808-*.
§Basic CRUD API
Elasticsearch implements a REST API with the HTTP verbs GET for read operations, PUT for update or replace, and DELETE to remove a document.
§Delete an Index
Delete an index named example.
curl -X DELETE \
  http://localhost:9200/example
If the index existed we get back:
{
    "acknowledged": true
}
If the index did not exist we would get:
{
    "error": {
        "root_cause": [
            {
                "type": "index_not_found_exception",
                "reason": "no such index",
                "index_uuid": "_na_",
                "resource.type": "index_or_alias",
                "resource.id": "example",
                "index": "example"
            }
        ],
        "type": "index_not_found_exception",
        "reason": "no such index",
        "index_uuid": "_na_",
        "resource.type": "index_or_alias",
        "resource.id": "example",
        "index": "example"
    },
    "status": 404
}
Keep in mind that although there is no consequence in issuing a DELETE for something that does not exist, Elasticsearch returns a “status”: 404.
§Create an Index
curl -X PUT \
  http://localhost:9200/example
§Create or Update a Document (Upsert)
A PUT command creates or overwrites a document if given an existing document id.
curl -X PUT \
  http://localhost:9200/example/test/123 \
  -H 'Content-Type: application/json' \
  -d '{
    "testId": "123",
    "description": "This is a test"
}'
§Get a Document
curl -X GET \
  http://localhost:9200/example/test/123
Returns:
{
    "_index": "example",
    "_type": "test",
    "_id": "123",
    "_version": 3,
    "found": true,
    "_source": {
        "testId": "123",
        "description": "This is a test"
    }
}
The _source sections stores the fields associated with a document.
§Mappings, Types and Metadata
For more advanced searching filtering you need to know the types of values stored for a document along with the various index mappings.
§Get Mapping
curl -X GET \
  http://localhost:9200/example/_mapping
In this simple example index both testId and description are of “type”: “text”. Elasticsearch is indexing the first 256 characters of both fields as a keyword.
{
    "example": {
        "mappings": {
            "test": {
                "properties": {
                    "description": {
                        "type": "text",
                        "fields": {
                            "keyword": {
                                "type": "keyword",
                                "ignore_above": 256
                            }
                        }
                    },
                    "testId": {
                        "type": "text",
                        "fields": {
                            "keyword": {
                                "type": "keyword",
                                "ignore_above": 256
                            }
                        }
                    }
                }
            }
        }
    }
}
§Create a Mapping
Create the index example2 along with a mapping:
curl -X PUT \
  http://localhost:9200/example2 \
  -H 'Content-Type: application/json' \
  -d '{
  "mappings": {
    "test": {
      "properties": {
        "description": { "type": "text"  },
        "TestId":      { "type": "integer" }
      }
    }
  }
}'
For the complete, see the official documentation on field datatypes for mapping.
§Searching
In the following examples assume the following example JSON snippets are POSTed to http://localhost:9200/wx-rtbeat-%2A/_search. The %2A is a URL encoded * (wildcard) allowing us to query all indexes starting with wx-rtbeat-.
Returning all documents with the field rxtxMsg.payload.currently.summary matching the term “Partly Cloudy”
POST http://localhost:9200/wx-rtbeat-%2A/_search
Post body:
{
  "query": {
    "match" : {
      "rxtxMsg.payload.currently.summary" : "Partly Cloudy"
    }
  }
}
§Range
Return all documents whose @timestamp is greater than or equal to 24 hours ago:
POST http://localhost:9200/wx-rtbeat-%2A/_search
Post body:
{
  "query": {
    "range" : {
      "@timestamp" : {
        "gte" : "now-24h"
      }
    }
  }
}
If you are interested only in the number of matches, you can limit the size of returned documents to 0
POST http://localhost:9200/wx-rtbeat-%2A/_search
Post body:
{
  "size":0,
  "query": {
    "range" : {
      "@timestamp" : {
        "gte" : "now-24h"
      }
    }
  }
}
§Filtering
The bool operator allows you to return any documents where the sub-conditions are true. In this case, we only implement one condition, a filter, however, that filter has an array of conditions.
In addition to the query the return fields are limited to those defined in "_source".
The following returns all documents in the last 72 hours where the summary is “Partly Cloudy” and the temperature is greater than or equal to 60 and less than or equal to 71.
POST http://localhost:9200/wx-rtbeat-%2A/_search
Post body:
{
  "query": {
    "bool": {
      "filter": [
        { "range" : { "@timestamp" : { "gte" : "now-72h" } } },
        { "term": { "rxtxMsg.payload.currently.summary": "Partly Cloudy" } },
        { "range" : { "rxtxMsg.payload.currently.temperature" : { "gte" : 60, "lte" : 71 } } }
      ]
    }
  },
  "_source": [
    "rxtxMsg.payload.currently.time",
    "rxtxMsg.payload.currently.temperature",
    "rxtxMsg.payload.currently.humidity",
    "rxtxMsg.payload.currently.pressure",
    "rxtxMsg.payload.currently.windSpeed",
    "rxtxMsg.payload.currently.summary"
  ]
}
§Aggregations
Below are examples of basic counts, averages, minimums and maximums along with histograms for percentile and percent rank. See the Official documentation on aggregations for a deeper understanding.
§Counts
Using the aggs condition, we can get document counts on all the terms for summary with additional filtering on temperature being greater-than or equal to 60.
Note that the “size” is set to 0 since we are not interested in returning any documents.
POST http://localhost:9200/wx-rtbeat-%2A/_search
Post body:
{
  "size": 0,
  "aggs": {
    "types": {
      "terms": {
        "field": "rxtxMsg.payload.currently.summary"
      }
    }
  },
  "query": {
    "bool": {
      "must": {
        "match_all": {}
      },
      "filter": {
        "range": {
          "rxtxMsg.payload.currently.temperature": {
            "gte": 60
          }
        }
      }
    }
  }
}
Example Output:
{
  "took": 13,
  "timed_out": false,
  "_shards": {
    "total": 5,
    "successful": 5,
    "skipped": 0,
    "failed": 0
  },
  "hits": {
    "total": 6632,
    "max_score": 0,
    "hits": []
  },
  "aggregations": {
    "types": {
      "doc_count_error_upper_bound": 0,
      "sum_other_doc_count": 0,
      "buckets": [
        {
          "key": "Clear",
          "doc_count": 4871
        },
        {
          "key": "Partly Cloudy",
          "doc_count": 1523
        },
        {
          "key": "Mostly Cloudy",
          "doc_count": 238
        }
      ]
    }
  }
}
§Averages, Minimums and Maximums
To demonstrate averages, minimums, and maximums, I use a nested agg condition.
The following returns a count for each term used in the summary field, along with the average, minimum and maximum temperature for that group.
POST http://localhost:9200/wx-rtbeat-%2A/_search
Post body:
{
  "size": 0,
  "aggs": {
    "types": {
      "terms": {
        "field": "rxtxMsg.payload.currently.summary"
      },
      "aggs": {
        "avg_temp": {
          "avg": {
            "field": "rxtxMsg.payload.currently.temperature"
          }
        },
        "max_temp": {
          "max": {
            "field": "rxtxMsg.payload.currently.temperature"
          }
        },
        "min_temp": {
          "min": {
            "field": "rxtxMsg.payload.currently.temperature"
          }
        }
      }
    }
  },
  "query": {
    "range": {
      "@timestamp": {
        "gte": "now-24h"
      }
    }
  }
}
Example output:
{
  "took": 13,
  "timed_out": false,
  "_shards": {
    "total": 5,
    "successful": 5,
    "skipped": 0,
    "failed": 0
  },
  "hits": {
    "total": 718,
    "max_score": 0,
    "hits": []
  },
  "aggregations": {
    "types": {
      "doc_count_error_upper_bound": 0,
      "sum_other_doc_count": 0,
      "buckets": [
        {
          "key": "Clear",
          "doc_count": 409,
          "avg_temp": {
            "value": 81.81280562347189
          },
          "min_temp": {
            "value": 71.6875
          },
          "max_temp": {
            "value": 88.75
          }
        },
        {
          "key": "Partly Cloudy",
          "doc_count": 192,
          "avg_temp": {
            "value": 71.58528645833333
          },
          "min_temp": {
            "value": 68.1875
          },
          "max_temp": {
            "value": 79.1875
          }
        },
        {
          "key": "Mostly Cloudy",
          "doc_count": 117,
          "avg_temp": {
            "value": 69.40331196581197
          },
          "min_temp": {
            "value": 68.5
          },
          "max_temp": {
            "value": 71
          }
        }
      ]
    }
  }
}
§Percentile
Obtaining the temperature field of our data in a series of percentiles requires creating a percentiles aggregator, this is merely wrapping the “percentiles” operator in a custom object. In this case I name the object “pct_temp”, however any name would suffice.
POST http://localhost:9200/wx-rtbeat-%2A/_search
Post body:
{
  "size": 0,
  "aggs": {
    "pct_temp": {
      "percentiles": {
        "field": "rxtxMsg.payload.currently.temperature",
        "percents": [
          1,
          5,
          25,
          50,
          75,
          95,
          99
        ]
      }
    }
  },
  "query": {
    "range": {
      "@timestamp": {
        "gte": "now-24h"
      }
    }
  }
}
Example output:
{
  "took": 15,
  "timed_out": false,
  "_shards": {
    "total": 5,
    "successful": 5,
    "skipped": 0,
    "failed": 0
  },
  "hits": {
    "total": 718,
    "max_score": 0,
    "hits": []
  },
  "aggregations": {
    "pct_temp": {
      "values": {
        "1.0": 68.25,
        "5.0": 68.5625,
        "25.0": 69.95982142857143,
        "50.0": 75.80357142857143,
        "75.0": 84.00483630952382,
        "95.0": 87.625,
        "99.0": 88.614375
      }
    }
  }
}
§Percent by Rank
Below, I use “percentile_ranks” to bucket the temperatures into four categories of interest.
POST http://localhost:9200/wx-rtbeat-%2A/_search
Post body:
{
  "size": 0,
  "aggs": {
    "pct_temp": {
      "percentile_ranks": {
        "field": "rxtxMsg.payload.currently.temperature",
        "values": [
          60,
          70,
          75,
          80
        ],
        "hdr": {
          "number_of_significant_value_digits": 2
        }
      }
    }
  },
  "query": {
    "range": {
      "@timestamp": {
        "gte": "now-24h"
      }
    }
  }
}
Example output:
{
  "took": 13,
  "timed_out": false,
  "_shards": {
    "total": 5,
    "successful": 5,
    "skipped": 0,
    "failed": 0
  },
  "hits": {
    "total": 718,
    "max_score": 0,
    "hits": []
  },
  "aggregations": {
    "pct_temp": {
      "values": {
        "60.0": 0,
        "70.0": 29.526462395543174,
        "75.0": 49.02506963788301,
        "80.0": 63.50974930362117
      }
    }
  }
}
§Percent by Rank Interval
I use “interval” to automatically generate rank buckets based on the value range. Intervals make building histograms easy when you have dynamic data that should not be scaled.
POST http://localhost:9200/wx-rtbeat-%2A/_search
Post body:
{
    "size": 0,
    "aggs": {
        "temps": {
            "histogram": {
                "field": "rxtxMsg.payload.currently.temperature",
                "interval": 2
            }
        }
    },
    "query": {
        "range" : {
            "@timestamp" : {
                "gte" : "now-24h"
            }
        }
    }
}
Example output:
{
  "took": 11,
  "timed_out": false,
  "_shards": {
    "total": 5,
    "successful": 5,
    "skipped": 0,
    "failed": 0
  },
  "hits": {
    "total": 718,
    "max_score": 0,
    "hits": []
  },
  "aggregations": {
    "temps": {
      "buckets": [
        {
          "key": 68,
          "doc_count": 173
        },
        {
          "key": 70,
          "doc_count": 77
        },
        {
          "key": 72,
          "doc_count": 69
        },
        {
          "key": 74,
          "doc_count": 43
        },
        {
          "key": 76,
          "doc_count": 31
        },
        {
          "key": 78,
          "doc_count": 51
        },
        {
          "key": 80,
          "doc_count": 44
        },
        {
          "key": 82,
          "doc_count": 48
        },
        {
          "key": 84,
          "doc_count": 53
        },
        {
          "key": 86,
          "doc_count": 104
        },
        {
          "key": 88,
          "doc_count": 25
        }
      ]
    }
  }
}
The example data is powered by the Dark Sky API. If you are interested in gathering your own weather data, check out my article High Traffic JSON Data into Elasticsearch on Kubernetes.
§Resources
- Elasticsearch
- How to install Elasticsearch
- Production Grade Elasticsearch on Kubernetes
- High Traffic JSON Data into Elasticsearch on Kubernetes
- Elasticsearch Search in Depth documentation
- Elasticsearch data types for mapping indexes
- Elasticsearch Aggregations