The eth-netstats project provides a great dashboard interface for monitoring the status of an Ethereum Blockchain from the perspective of its nodes. The website https://ethstats.net/ reports statistics from an extensive list of Ethereum nodes on the public Ethereum Blockchain, however, the eth-netstats software that drives https://ethstats.net/ can also be used to monitor a Private Ethereum Blockchchain as I demonstrate in the previous article Deploy a Private Ethereum Blockchain on a Custom Kubernetes Cluster.
The eth-netstats service consumes Ethereum statistical metrics provided by individual Ethereum nodes. Check out the documentation on Geth if you are interested in running an Ethereum miner or transaction only node and pointing its statistical output to an eth-netstats instance.
In this article, I review each of the metrics displayed by eth-netstats, as both a means to better understand the eth-netstats utility as well as Ethereum itself.
§2026 Update
ethstats was built for Proof of Work Ethereum, and that shows here. About half the metrics on this dashboard, hashrate, mining difficulty, uncles, and “miners”, are PoW concepts, and Ethereum left them behind at The Merge in September 2022 when it switched to Proof of Stake. On mainnet today there is no hashrate and no difficulty, blocks come from validators on a fixed twelve-second slot instead of miners racing, and uncles no longer exist. Read the mining-related rows below as history.
The rest still holds. Peers, gas price and gas spending, transactions and pending transactions, block and propagation timing, node latency and uptime are all just as meaningful on a Proof of Stake chain.
For monitoring a real node now, ethstats is not the tool. eth-netstats, the software behind ethstats.net, is largely unmaintained and tied to the mining era. Modern Ethereum nodes expose Prometheus metrics that you watch with Grafana, and the client teams publish ready-made dashboards for geth, Besu, and the consensus clients. If you run a private Besu or geth Clique chain, that same Prometheus-and-Grafana setup gives you block production, gas, peers, and sync status without the PoW baggage.
This pairs with Ethereum Blockchain on Kubernetes, which I updated for the post-Merge world as well.
Original article below. Everything from here down is the post as originally written. The 2026 Update above covers what’s changed since.
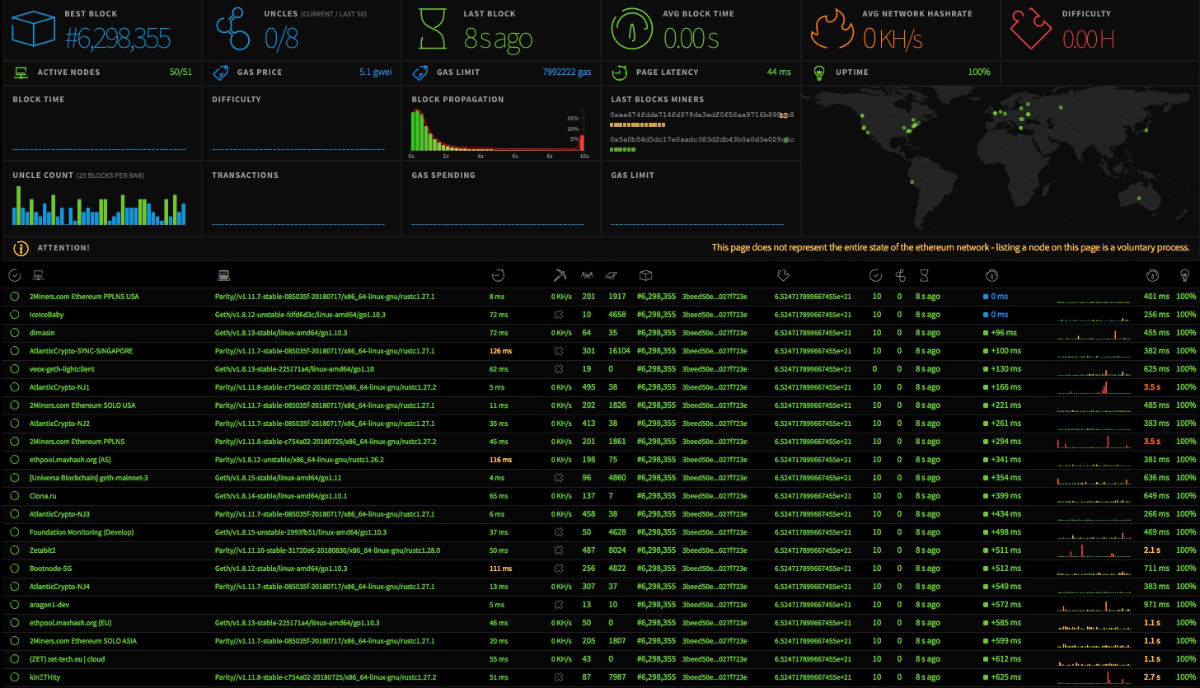
See Ethstats in action at https://ethstats.net/ for a live example of Ethereum Blockchain metrics from miners on the public Ethereum blockchain.
The following table is a brief overview of the metrics displayed by eth-netstats starting from the top left, moving from left to right, row by row.
| Image | Metric | Description |
|---|---|---|
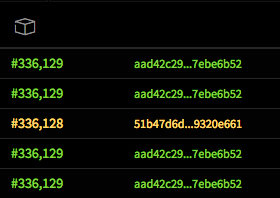
 | Best Block | The Best Block is the last valid block with the highest amount of accumulated work in it on the main Ethereum Blockchain. |
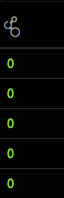
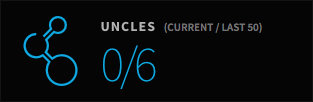 | Uncles | Uncles are orphaned blocks that were mined just after someone else found the correct block header. Ethereum treats orphaned blocks differently than other blockchain systems by including them in the blockchain and rewarding miners for them. Ethstats displays the current block's uncle count and uncle count of the last 50 blocks. |
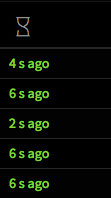
 | Last Block | Ethstats displays the elapsed time since the last block was mined. |
 | Average Block Time | The average time between block generation, not including uncles. |
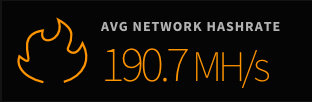 | Average Network Hashrate | The number of hashes per second processed by miners on the network in order to find a new block. The Network in this case being miners reporting to Ethstats. |
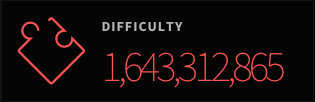 | Difficulty | The current difficulty to mine a new block by finding a matching hash. |
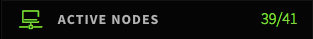 | Active Nodes | The number of nodes currently connected to the Ethstats service. |
 | Gas Price | Gas Price is the current price miners will accept for processing a transaction. |
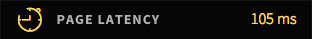 | Page Latency | The latency in time between a rendered Etherstats front-end dashboard (in your web browser) and its backend data service. |
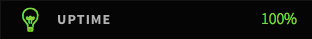 | Uptime | The amount of time Etherstats has been running since started or re-started. |
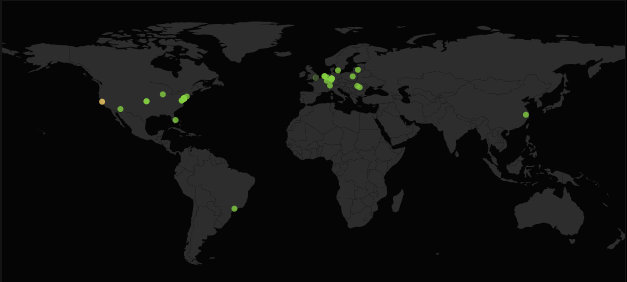 | Geo Locations | Location of Ethereum nodes reporting to Etherstats. |
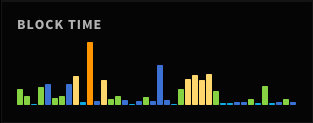 | Blocktime Chart | Blocktime averages over time. |
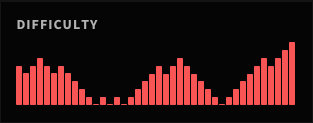 | Difficulty Chart | Difficulty over time. |
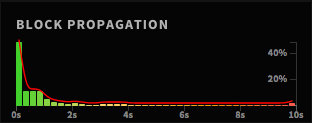 | Block Propagation | Block Propagation tracks the speed in which blocks are shared between nodes connected to Ethstats. |
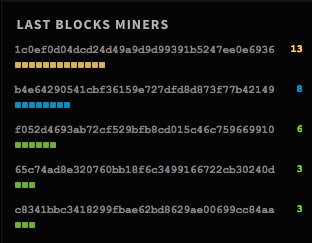 | Last Blocks Miners | Nodes that found the most Blocks, not including Uncles. |
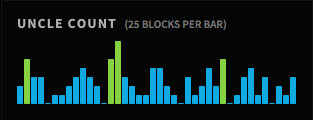 | Uncle Count | Uncle Count displays the number of Uncles generated. Each bar represents 25 blocks. |
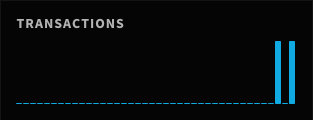 | Transactions | Displays the number of transactions included in the latest blocks. |
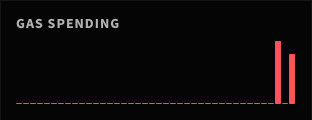 | Gas Spending | The amount of Gas spent on transactions in recent blocks. |
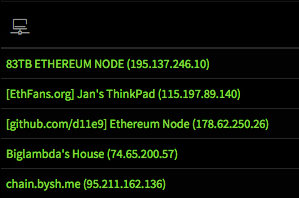 | Node Name |
|
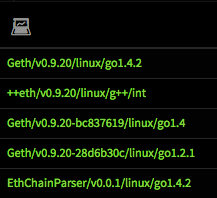 | Node Type | Type and architecture of connected Ethereum nodes. Common node types are Geth, Ethminer and Parity.
|
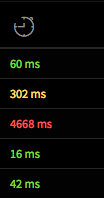 | Node Latency | The latency in time between the reporting node and Ethstats. |
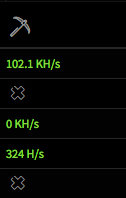 | Node Miner Hash Rate | The hash rate the node reporting to Ethstats. |
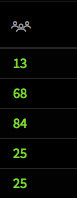 | Node Peers | Number of peers connected to a specific node. |
Pending Transactions | Number of transactions pending for a specific node. | |
 | Node Last Block | The Last Block a specific node is aware of. |
Block Transactions | Number of transactions a node is aware of and pending. These transactions will be added to the next block. | |
 | Node Uncles | Number of Uncles a node has reported creating. |
 | Last Block Time | The last time a node was aware of a Block being created. |
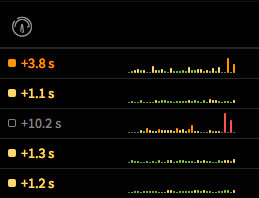 | Propagation Time | How long a block takes to propagate to a node over time. |
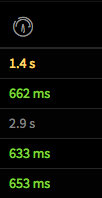 | Average Propagation Time | The average time it takes to propagate a block to this node. |
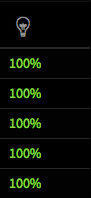 | Node Uptime | Node Uptime reports the percentage of time a node has reported as running since connected to Ethstats. |